5 Steps to Build Onboarding Feedback Loops
Learn to build SaaS onboarding feedback loops in 5 steps: set goals, collect user insights, analyze drop-offs, test fixes, and close the loop to boost activation
:quality(82)/blog/authors/yana.webp)
:quality(82)/blog/build-onboarding-feedback-loops-steps/IpYp2djXlomhiNtxSXhy1xJMF8s.png)
Most SaaS teams collect onboarding feedback. Very few actually use it.
After working on 80+ SaaS products, we keep seeing the same pattern: teams add a survey, file the results, and change nothing. The feedback sits in a spreadsheet. Activation stays flat. Churn stays high.
A feedback loop is different from feedback collection. Collection is a one-way street: you ask, users answer, nothing happens. A loop means the output of one cycle becomes the input of the next. You collect, analyze, act, tell users what changed, and then collect again. Each cycle sharpens your onboarding.
Here’s how to build one that actually works.
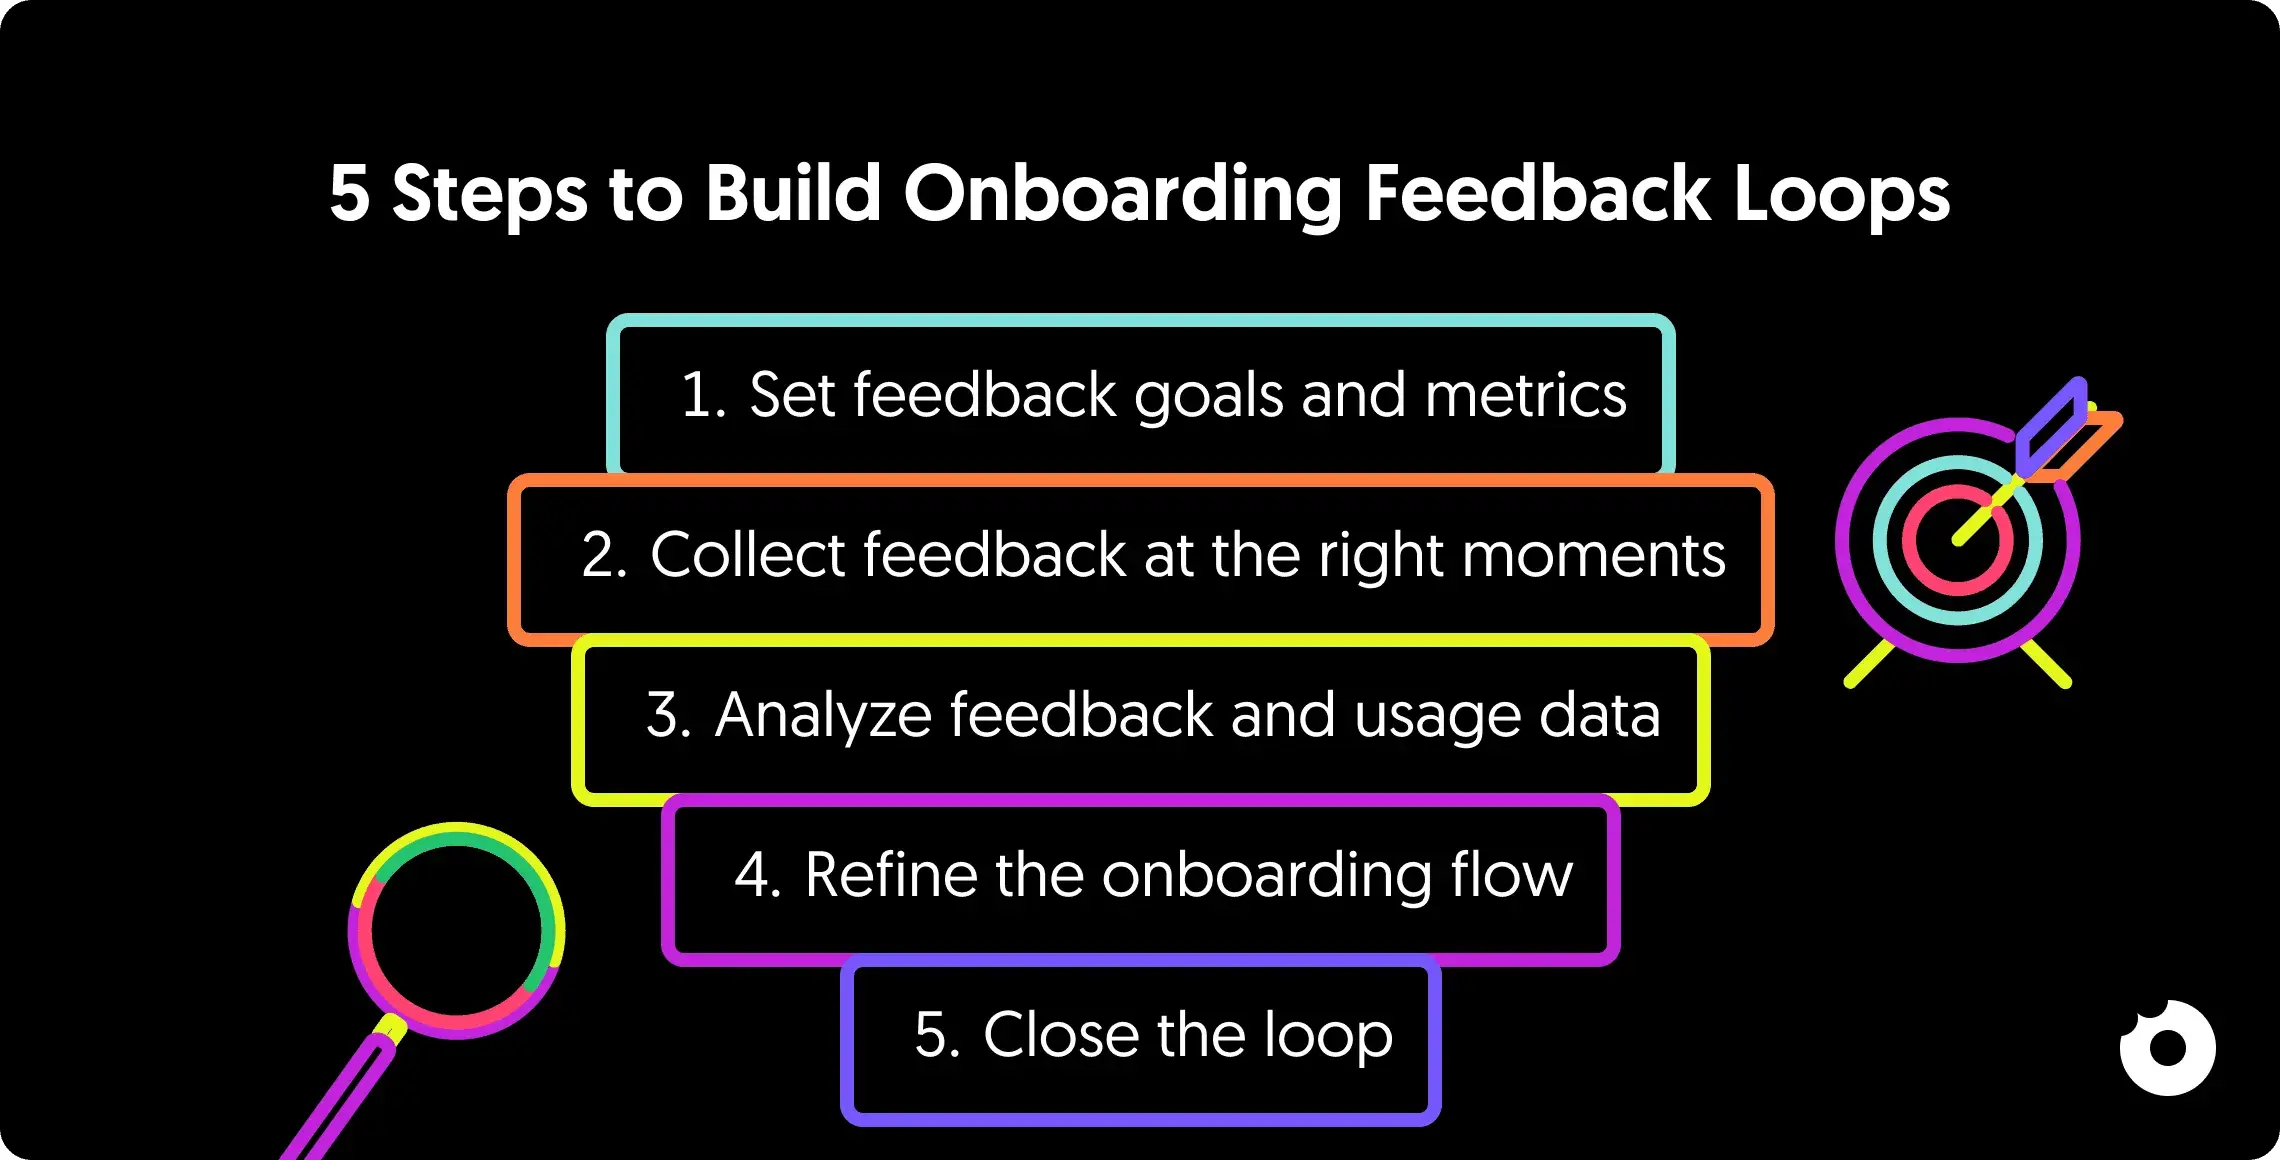
Step 1: Set Feedback Goals and Metrics
Before collecting feedback, you need a clear idea of what you’re trying to solve and how you’ll measure success. Without specific objectives, you’ll end up with scattered opinions and no actionable direction.
Start by setting baselines for your current performance, like time-to-value or completion rates, so you can track the impact of changes.
Your goals should align with your product strategy, not react to every user suggestion. Focus on closing the gap between user intent (why they signed up) and product value (their “Aha!” moment). Use your data to identify problem areas: high drop-off rates during onboarding, spikes in support tickets at certain steps, or low activation metrics. These friction points should guide your objectives.
Define Your Onboarding Goals
Set specific, measurable goals that lead users to their first success, whether that’s completing account creation or finishing a product tour. Different user groups, like technical versus non-technical users, may need separate goals and success markers. Pinpoint what “value” looks like for each segment.
Choose Your Success Metrics
Use a mix of leading indicators to predict outcomes, alongside lagging indicators to gauge long-term effects. Here’s a breakdown of the key onboarding metrics:
| Metric | What It Measures | Why It Matters |
|---|---|---|
| Time to Value (TTV) | Time until users achieve their first win | Tracks onboarding efficiency |
| Feature Adoption Rate | Percentage of users engaging with key features | Shows if users are finding core value |
| Funnel Completion Rate | Steps where users drop off | Pinpoints exact areas causing exits |
For metrics like Time to Value, use median (p50) or p75 values instead of averages to avoid skewed data from outliers. Segment your metrics by user cohort too, since organic signups and invited users often behave differently.
For more on setting up your analytics foundation, see our guide on creating a tracking plan.
Step 2: Collect Feedback at the Right Moments
Timing matters more than tooling. Ask for input when the experience is fresh and the context is clear.
The best strategy blends active and passive methods. Active tools, like in-app surveys and feedback widgets, capture immediate reactions during key moments. Passive tools, such as session replays, capture behavior users won’t articulate on their own.
Here’s why that matters: research suggests only about 1 in 26 unhappy users will actually tell you something is wrong. The rest leave quietly. Relying only on volunteered feedback gives you a structurally biased sample, skewed toward your most vocal users.
Add In-App Surveys and Prompts
Trigger surveys at critical milestones: completing a product tour, publishing a project, or using a feature for the first time. Keep surveys short, ideally 1-3 questions. Longer ones tank response rates.
Target your surveys to specific user groups. A SaaS we worked with used a simple 2-question survey right after users completed their tutorial and saw a 60% completion rate, with 10% providing detailed feedback that shaped product updates.
Combine scalar ratings (e.g., 1-10) with an open-ended question to uncover the reasoning behind user behavior. Avoid leading questions, as they can distort your data.
| Survey Type | Primary Goal | When to Trigger |
|---|---|---|
| Welcome Survey | Segment users by role/intent | During sign-up or first login |
| CES (Effort) | Evaluate ease of use | After completing a key task for the first time |
| CSAT (Satisfaction) or NPS (Loyalty) | Gauge long-term sentiment | 1-2 weeks after onboarding |
To encourage participation in high-priority surveys, consider offering rewards like discount codes, bonus credits, or temporary premium access. And optimize surveys for mobile so they don’t break navigation on smaller screens.
Watch Out for Survey Fatigue
There’s a paradox here: you need feedback to improve onboarding, but asking for feedback during onboarding creates friction. If every screen ends with “How was this step?”, you’re adding to the problem you’re trying to solve.
A few ground rules we follow across projects:
- Never ask more than 3 questions per survey
- Never trigger the same survey twice in one session
- Space surveys at least 48 hours apart
- Use behavioral signals (session replays, drop-off data) before resorting to direct questions
- If response rates drop below 10%, you’re over-surveying
Send Follow-Up Emails and Check-Ins
Email is a solid fallback for users who skip in-app surveys or stop engaging. Use webhooks or tools like Customer.io to trigger email surveys based on specific actions, ensuring the experience is still fresh. Sending follow-up surveys 1-2 weeks after onboarding can highlight unmet needs or overlooked product gaps.
Emails are especially useful for re-engaging inactive users. A simple email asking why they’ve stopped logging in can uncover friction points and bring them back.
Personalize these follow-ups based on user sentiment. Happy users? Ask for testimonials or reviews. Frustrated users? Offer a direct call with a customer success manager. Always acknowledge feedback with a thank-you message. According to Userpilot, 83% of customers feel more loyal to brands that respond to and resolve their complaints.
Segment Feedback by User Type
Generic surveys lead to generic insights. Segment your audience before sending surveys. A quick welcome survey with 1-3 questions after signup can identify a user’s role, industry, and main goals. This early segmentation lets you create personalized onboarding paths from the start.
Common segments include job roles (e.g., Manager vs. Freelancer), company size, and specific use cases (e.g., school, work, or personal). Beyond demographics, behavioral segmentation, grouping users by whether they’ve reached their “Aha!” moment, stalled at specific steps, or contacted support, can uncover insights that broader surveys miss.
Organize qualitative feedback by tagging themes. You might find that pricing confusion or technical issues are more common among trial users or certain professional roles.
Step 3: Review Feedback and Usage Data
Collecting feedback is the starting point. The real value comes from pairing it with usage data to see the full picture. Analytics show the “what” (drop-off points, slowdowns), while feedback explains the “why” (users’ struggles in their own words). Combining these two sources reveals patterns that neither can show alone.
Match qualitative feedback to specific user actions. If your analytics reveal users frequently abandon the account setup screen, deploy a survey targeting those users to capture their immediate reaction. Organize open-ended responses into categories like technical glitches, pricing confusion, or interface issues to find recurring themes.
Mix Survey Data with Analytics
Visualize your onboarding process as a conversion funnel, then layer in insights from surveys, support tickets, and chat logs. This helps you pinpoint the exact screens or steps causing drop-offs. For a deeper dive into combining data sources, our guide on getting insights from product analytics covers this in detail.
Session replays can be particularly eye-opening. Tools like FullStory, Hotjar, or Clarity let you watch real users interact with your product. You’ll see users repeatedly clicking buttons that don’t work, struggling to complete forms, or navigating in completely unexpected ways. These are issues they’ll rarely mention in surveys.
Your support team is another underrated source. Through chat reviews, you might notice users frequently asking the same question during onboarding. That’s a signal to update the workflow and address the confusion before it becomes a pattern.
AI-assisted analysis is worth considering at scale. If you’re receiving hundreds or thousands of feedback responses, tools that categorize and prioritize feedback automatically can surface patterns you’d otherwise miss. This is especially useful for tagging open-ended responses by theme and severity.
Find Where Users Get Stuck
Focus on the friction points that impact the largest number of users. Look for signs of confusion: users lingering on certain screens or skipping steps entirely.
Segment your analysis by user type, since different groups often face unique challenges. A feature that seems intuitive to technical users may be completely confusing to non-technical ones. We’ve seen this across dozens of SaaS products, particularly in onboarding flows that assume familiarity with industry jargon or complex integrations.
| Analysis Method | Data Type | What It Reveals |
|---|---|---|
| Funnel Analysis | Quantitative | Exact drop-off points in the flow |
| Session Replays | Qualitative | Real-time confusion and unexpected behavior |
| Thematic Coding | Qualitative | Recurring issues across feedback channels |
| Segmentation | Mixed | Problems specific to certain user groups |
Some obstacles are harder to detect because users abandon the process without saying a word. Session replays help you identify these “silent churn” triggers. Research suggests that testing with as few as five users can surface most major usability issues, making this a quick way to validate your findings before committing to larger changes.
A practical approach: test your own onboarding flow on a fresh device regularly. You’ll catch bugs and usability issues before users report them. We recommend doing this after every significant release.
Need a structured approach? A UX audit can systematically identify where your onboarding experience breaks down.
Step 4: Update and Test Onboarding Designs
After identifying friction points, it’s time to refine the design. Focus on targeted adjustments that address specific issues and are testable.
Use the RICE framework (Reach, Impact, Confidence, Effort) to prioritize updates. Give precedence to changes that affect core workflows or a significant portion of users, rather than acting on isolated feedback. Integrating user input early in the design phase can cut rework significantly, while fixing issues post-release costs dramatically more.
Improve Onboarding Flows
Address the most critical friction points first. If analytics show users abandoning a setup screen, consider progressive disclosure, delaying or simplifying complex settings. For a structured approach to redesigning your onboarding flow, the Bowling Alley Framework provides a step-by-step method for identifying which steps to keep, delay, or remove.
Shift your messaging from feature-focused to outcome-focused. Instead of “Set up integrations”, try “Connect your tools for seamless workflows.” Make one change at a time so you can measure the precise impact. Use feature flags to test changes with a small group before rolling out broadly.
Not every friction point needs removing. There’s growing evidence that some friction is valuable. Users who go through a slightly more involved onboarding sometimes retain better than those who go through a frictionless flow. The friction forces them to build a mental model of the product. The question isn’t “how do we remove all friction?” but “which friction is teaching users, and which is just annoying them?”
Run A/B Tests on Changes
Structure your tests using an “If-Then-Because” framework. For instance: “If we simplify email verification, then activation increases by 15% because friction is reduced.”
On average, only about 25% of users complete onboarding for SaaS platforms, but systematic testing can boost activation rates meaningfully. Before running tests, set a significance level (commonly α = 0.05) and aim for 80-90% power to ensure reliable results.
If you don’t have advanced A/B testing tools, implement changes temporarily and compare before-and-after data. Track both quantitative metrics (completion rates, time-to-value) and qualitative feedback (user comments, support tickets) to understand not just what changed, but why it worked or didn’t.
Know When NOT to Act on Feedback
Not every piece of feedback deserves an experiment. Some feedback reflects a single user’s preference, not a systemic problem. Some suggestions conflict directly with your product strategy.
Before acting on feedback, ask:
- Does this issue appear across multiple user segments?
- Does it affect a core workflow or a secondary feature?
- Is the requested change aligned with where the product is headed?
- Would implementing this create complexity for other users?
Saying no to feedback is just as important as acting on it. The goal isn’t to build everything users ask for. It’s to build the right things.
Work Directly with Users
Testing with first-time users reveals hidden friction that leads to silent churn. Watching new users interact with your product highlights missed steps and moments of hesitation. Research shows that just five user tests can uncover most usability issues.
If you’re running user interviews for the first time, our 7-step guide to effective user interviews covers the process in detail.
During live sessions, let users customize their experience, like rearranging components to match their preferences. This replaces internal assumptions with real-world evidence and helps teams avoid unnecessary debates.
Step 5: Share Updates and Track Results
Letting users know about changes you’ve made based on their feedback turns feedback into a two-way conversation and strengthens trust. 83% of customers feel more loyal to brands that address and resolve their complaints. On the flip side, 73% of customers will leave after three negative experiences. Acting on feedback and communicating that action encourages ongoing engagement.
Tell Users About Updates
Choose the right channel based on the update’s significance:
- Major feature launches that reshape workflows: in-app modals
- Smaller updates like bug fixes or minor UI improvements: banners or tooltips
- Individual issue resolution: personalized email to the user who reported it
For broader transparency, maintain public changelogs or engage with users in community forums. These keep your users informed and invite dialogue about the changes.
When you can’t act on a suggestion, explaining why and offering alternatives shows users their input is still valued.
Monitor Metrics Over Time
Set up systems to automatically track key performance indicators: retention rates, feature adoption, and satisfaction scores (NPS, CSAT, CES). Break these metrics down by user segments to spot emerging trends. Keep an eye on time-to-value, how quickly users achieve their first meaningful success after updates, to gauge real-world impact.
Document your hypotheses, results, and lessons learned in a central repository. This prevents repeated mistakes and informs future decisions. Our guide on getting insights from analytics has more on building this habit into your process.
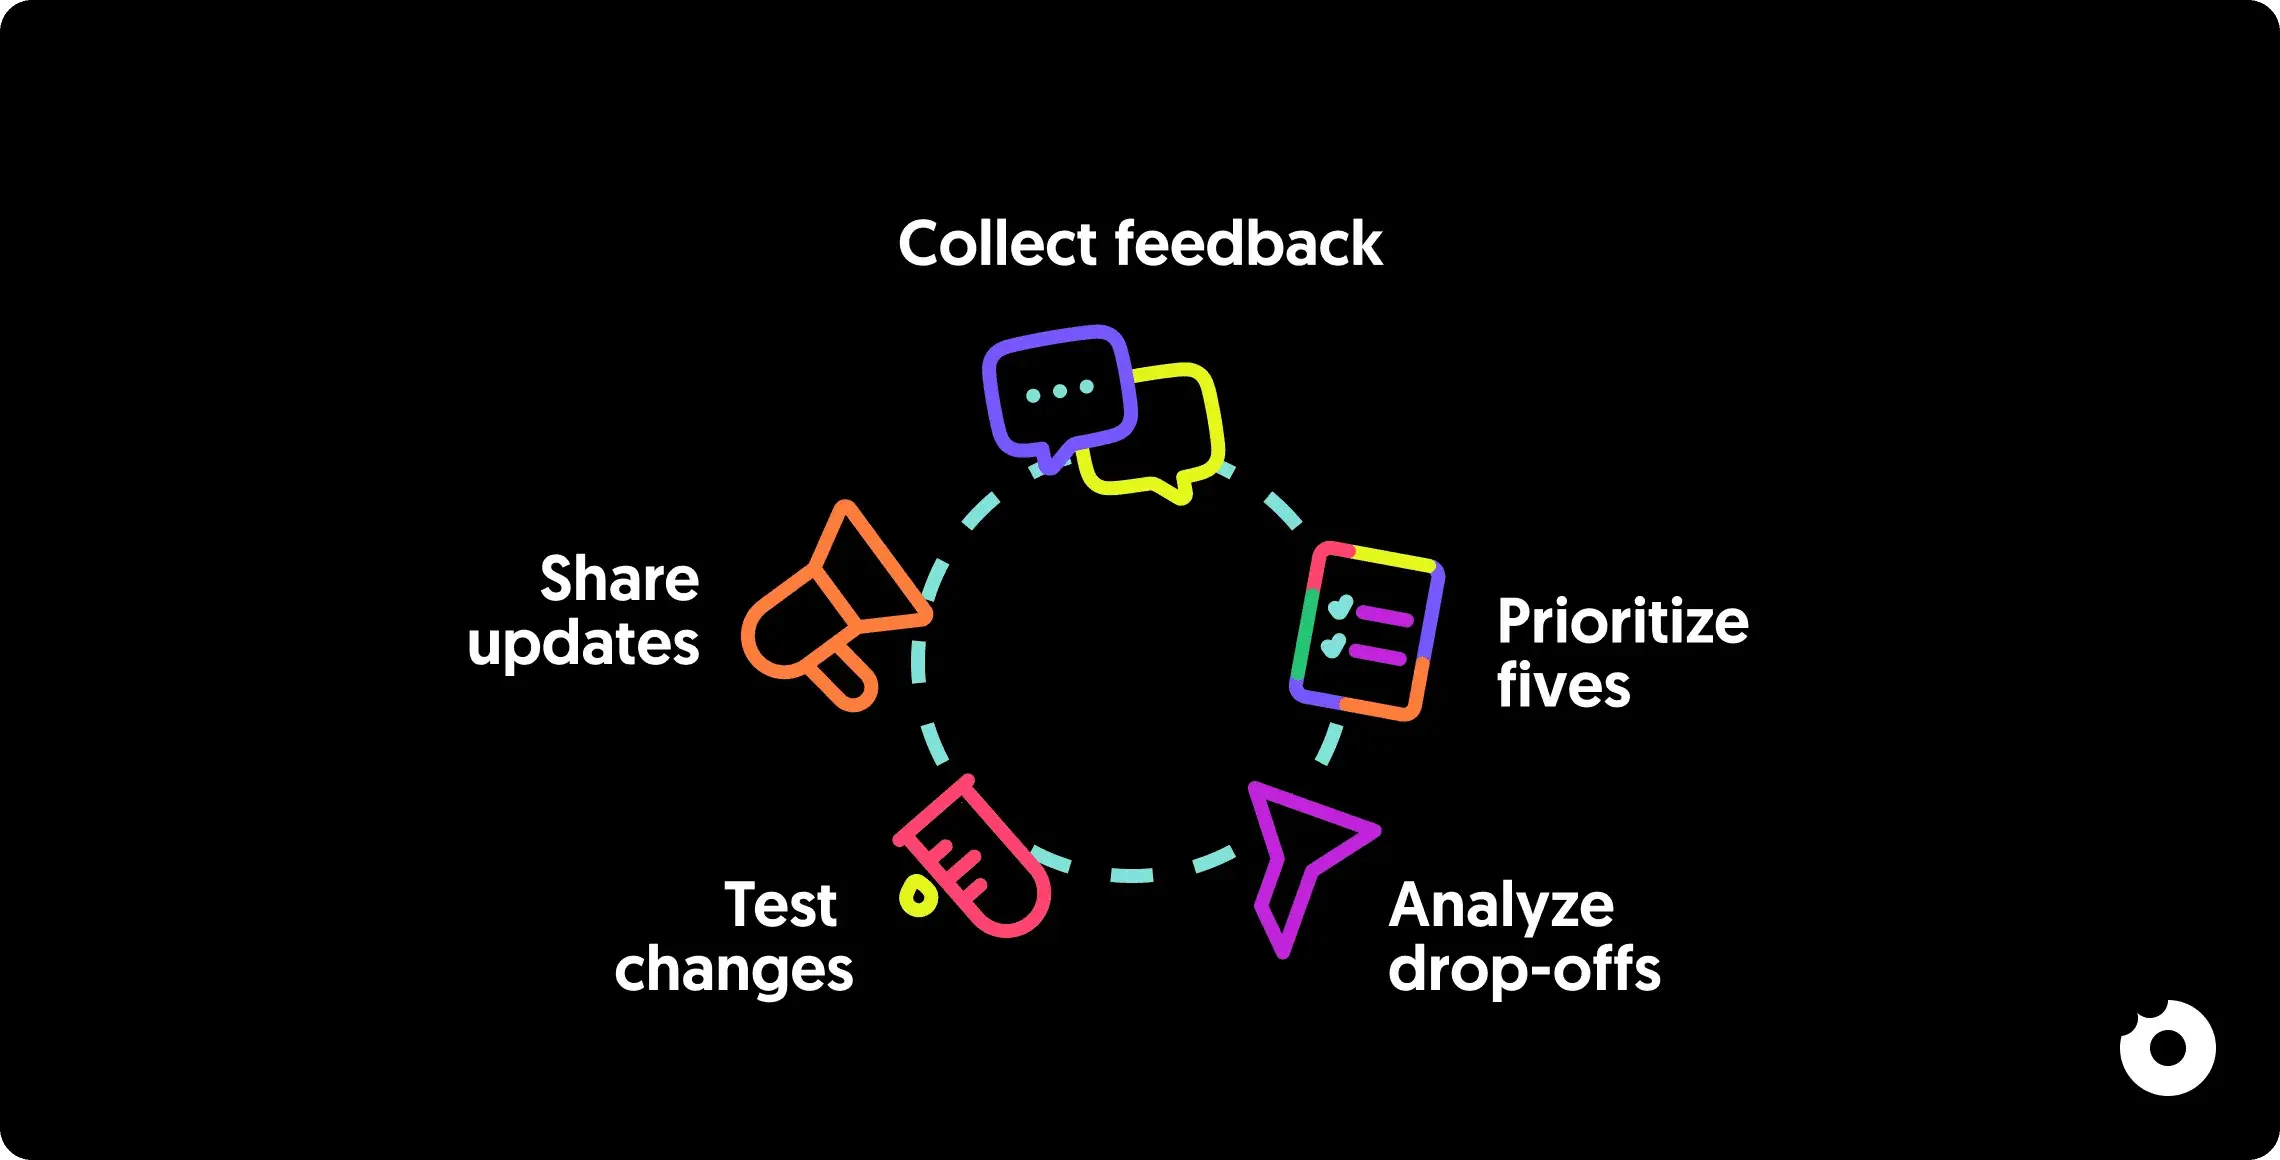
Each cycle should feed the next. The metrics you track after implementing changes in Step 5 become the baselines for your next round of goal-setting in Step 1. That’s what makes this a loop, not a checklist.
A Note on Product-Market Fit
No feedback loop can save onboarding if product-market fit is weak. If users consistently bounce during onboarding despite multiple iterations, the issue might not be the flow itself but whether the product solves a problem users are willing to pay for. Before investing heavily in onboarding optimization, make sure users who do complete onboarding are actually retaining and expanding. If they’re not, the problem is upstream.
Conclusion
Building onboarding feedback loops is a continuous process, not a one-time project. The five steps work together as a cycle: Step 1 defines what success looks like, Step 2 collects the data, Step 3 uncovers why users struggle, Step 4 tests targeted fixes, and Step 5 closes the loop by sharing what changed and measuring the result.
After working across 80+ SaaS products, the pattern is clear: teams that treat onboarding as a living system, not a static flow, see compounding improvements in activation and retention. The teams that struggle are the ones who collect feedback, file it, and forget it.
Start small. Pick one friction point. Measure it. Fix it. Tell users what you changed. Then do it again.
Want a professional audit of your onboarding experience? Get in touch with our team - we’ve helped 80+ SaaS companies improve their product design and onboarding flows.
:quality(80)/blog/gui-was-a-patch/the-gui-was-a-patch.png)
:quality(82)/blog/pragmatic-b2b-saas-design-listing/GvPwajE4C3d7q8qkK9y2Lgmpd0.png)
:quality(82)/blog/introduction-to-design-tokens/pJG6ebrc0tzPoDQWWSZXolLXUPE.png)